Difference between revisions of "Effects of weir construction"
(Created page with "<Forecasterlink type="getToolInfoBox" code="33" /> =Effects of weir construction= ==Type== Diagrams of elementary morphological effects ==Rivertypes== <Forecasterlink type="...") |
|||
| (One intermediate revision by the same user not shown) | |||
| Line 1: | Line 1: | ||
| − | + | ==Description== | |
| − | = | + | [[File:Effect of weir construction.png|300px|thumbnail]] |
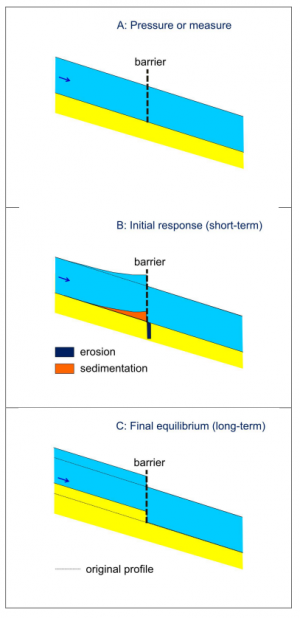
| − | + | The longitudinal profiles of Figures A to C visualize how weir construction affects the main channel of a river reach. The vertical scale is exaggerated with respect to the horizontal scale. The reach can be kilometres to tens of kilometres long.<br /> | |
| − | + | ||
| + | |||
| + | The intervention implies essentially that a weir is constructed across the river at a certain location (A). The immediate effect is an increase in water levels upstream (B). This increase is not uniform, but varies from place to place. As a consequence, flow velocities differ from place to place too. The water levels and flow velocities can be calculated using [[1D analytical models for gradually-varied flow]] or [[1D numerical hydrodynamic models]]. The variations in flow velocity and, hence, the variations in the capacity to transport sediment give rise to a pattern of initial erosion and sedimentation along the river (B) that can be calculated using [[1D analytical models for morphology on short time scales]] or [[1D numerical morphodynamic models]]. Sedimentation over a relatively long distance occurs upstream of the intervention, whereas punctuated local erosion occurs downstream. This erosion advances downstream as a rarefaction wave.<br /> | ||
| + | |||
| + | |||
| + | Eventually, in the long run, the river reaches a new morphological equilibrium without further trends of erosion or sedimentation (C). Upstream bed and water levels have become higher than at the start of the intervention. Downstream, the river resumes its original shape by sedimentation after an intermediate period of erosion.<br /> | ||
| + | |||
| + | |||
| + | The longitudinal profiles in the diagrams provide a simplified picture. They do not include the response of channel width, bed sediment composition or vegetation. Nonetheless, they offer the key to understanding the relation between local pressures or measures and their effects far upstream and downstream.<br /> | ||
| − | |||
| − | |||
==Related Pressures== | ==Related Pressures== | ||
| Line 19: | Line 25: | ||
<Forecasterlink type="getBqeForTool" code="33" /> | <Forecasterlink type="getBqeForTool" code="33" /> | ||
| − | |||
| − | |||
| − | |||
| − | |||
| − | |||
| − | |||
[[Category:Tools]][[Category:Diagrams of elementary morphological effects]] | [[Category:Tools]][[Category:Diagrams of elementary morphological effects]] | ||
Latest revision as of 14:29, 11 December 2015
Contents
Description
The longitudinal profiles of Figures A to C visualize how weir construction affects the main channel of a river reach. The vertical scale is exaggerated with respect to the horizontal scale. The reach can be kilometres to tens of kilometres long.
The intervention implies essentially that a weir is constructed across the river at a certain location (A). The immediate effect is an increase in water levels upstream (B). This increase is not uniform, but varies from place to place. As a consequence, flow velocities differ from place to place too. The water levels and flow velocities can be calculated using 1D analytical models for gradually-varied flow or 1D numerical hydrodynamic models. The variations in flow velocity and, hence, the variations in the capacity to transport sediment give rise to a pattern of initial erosion and sedimentation along the river (B) that can be calculated using 1D analytical models for morphology on short time scales or 1D numerical morphodynamic models. Sedimentation over a relatively long distance occurs upstream of the intervention, whereas punctuated local erosion occurs downstream. This erosion advances downstream as a rarefaction wave.
Eventually, in the long run, the river reaches a new morphological equilibrium without further trends of erosion or sedimentation (C). Upstream bed and water levels have become higher than at the start of the intervention. Downstream, the river resumes its original shape by sedimentation after an intermediate period of erosion.
The longitudinal profiles in the diagrams provide a simplified picture. They do not include the response of channel width, bed sediment composition or vegetation. Nonetheless, they offer the key to understanding the relation between local pressures or measures and their effects far upstream and downstream.
Related Pressures
- Colinear connected reservoir
- Artificial barriers downstream from the site
- Artificial barriers upstream from the site
- Impoundment
Related Measures
- No measures apply to this tool.
Related Hymo quality elements
- Quantity and dynamics of water flow (Class: Hydrological regime)
- River continuity (Class: River continuity)
Related Biological quality elements
- No Biological Quality Elements apply to this tool.
